OpenTelemetry: Looking into the black box
Observability has become a cornerstone of modern software development, and OpenTelemetry has emerged as a powerful tool to enable observability and streamline the monitoring of modern software systems. Learn more about it!


As a DevOps engineer, there is one thing you dread the most: a 3AM call from your manager saying the all important service has gone down and no one knows the cause. What’s more, this is your biggest account and your company’s existence depends upon this one service being up. Doomsday scenario to say the least. Of course you ask for logs, maybe for any alert flags that were raised or traces. Maybe metrics of the system could help explain the outage behavior. All of these would help you gain access to critical knowledge that would help you debug. But none of these are present, you are completely in the dark about this outage and even the system behavior. Hopefully, this is the moment you wake up and breathe a sigh of relief because you have already added tools into place that give you observability.
Observability has become a cornerstone of modern software development, helping developers tackle the challenges posed by distributed and microservices-based architectures. Unlike traditional debugging, observability focuses on providing real-time insights into an application’s internal state, allowing developers to identify bottlenecks, troubleshoot issues, and optimize performance. With applications becoming more intricate and spread across multiple services, observability is no longer a luxury but a necessity.
OpenTelemetry, a revolutionary open-source project, has emerged as a powerful tool to enable observability and streamline the monitoring of modern software systems. Born from the merger of two existing projects, OpenTracing and OpenCensus, OpenTelemetry brings together the best of both worlds to create a unified and extensible framework for observability. By offering a common set of APIs, libraries, agents, and instrumentation, OpenTelemetry simplifies the process of integrating observability into applications.
In this article, we will focus on three outputs from an application: logs, traces, and metrics. We will learn how to instrument, generate, collect, and export telemetry data so that you will never find yourself in a situation where you do not have insight into the runtime behavior of your application. We will use OpenTelemetry SDKs to instrument a Go client and server so that the application will emit telemetry to the OpenTelemetry Collector service. The OpenTelemetry Collector service will transform and export that telemetry data to backend systems to enable visualization, analysis, and alerting.
OpenTelemetry includes the following components:
- Libraries for instrumenting widely used programming languages, offering both automated and manual instrumentation options.
- A unified collector binary capable of being deployed through various methods.
- Pipelines designed for the collection, conversion, and export of telemetry data.
- A collection of open standards designed to prevent dependency on a single vendor.
OpenTelemetry Collector
A conceptual reference architecture diagram for OpenTelemetry (OTel):
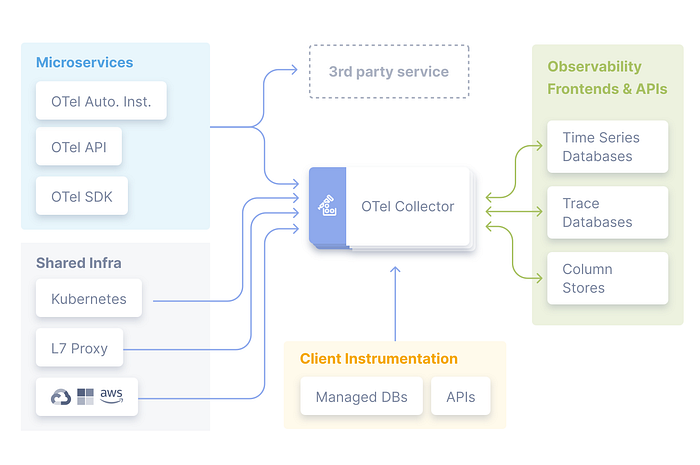
The OTel Collector is a vendor-agnostic proxy that can receive telemetry data in multiple formats, transform and process it, and export it in multiple formats to be consumed by multiple backends (such as Jaeger, Prometheus, other open source backends, and many proprietary backends). As you can see in our architecture diagram, the OTel collector is central to our observability system. The OTel Collector is composed of the following:
- Receivers: Push- or pull-based processors for collecting data
- Processors: Responsible for transforming and filtering data
- Exporters: Push- or pull-based processors for exporting data
Each of the preceding components is enabled through pipelines described in YAML configurations.
The correlation of telemetry
In complex distributed systems, understanding the relationships between different components and their interactions is essential to identify bottlenecks and troubleshoot issues. Correlation, in the context of telemetry, refers to the ability to link related events or data points across various services and components of an application.
OpenTelemetry facilitates correlation through the concept of context propagation. A context, often referred to as a trace context, is a container for storing metadata and contextual information about a request or transaction. This context is carried across different services and components as requests flow through the system. By attaching the same context to logs, traces, and metrics generated by different services, we can easily follow the path of a request and gain insights into its journey through the application’s architecture.
Correlation is particularly crucial in diagnosing performance issues or errors that span multiple services. Without proper correlation, tracking down the root cause of an issue can be like searching for a needle in a haystack. OpenTelemetry’s ability to maintain consistent trace contexts across various services simplifies the process of linking logs, traces, and metrics related to a particular transaction or request.
Traces and Spans
We have talked a lot about traces and their key role in making a system observable. But what exactly is a trace?
Think of a trace as a journey map for a single action or request that goes through different parts of a computer system. Imagine you’re ordering a pizza online. The trace would be like a timeline that shows every step your pizza order takes, from the moment you click “Order” to when the pizza arrives at your door. It includes all the different stops or places your order goes through, like the order processing, baking, packaging, and delivery. This trace helps you see the entire path your pizza takes and how long each part of the process takes.
A span is like a small part of the journey described in the trace. Going back to the pizza example, a span would be like focusing on just one specific step in the process, such as when the pizza is being baked in the oven. It gives you detailed information about what happened during that particular step — like how hot the oven was, how long the pizza was inside, and if there were any special instructions followed. Spans help you understand the details of each individual step that makes up the entire journey.
In a computer system, traces and spans work similarly. Traces show you the entire path of a request or action as it moves through different parts of the system, while spans break down each step into smaller, more detailed pieces of information. This helps developers and system operators understand how things are working, where there might be slowdowns or issues, and how to improve the overall performance of their applications.Traces that can propagate across components in a system are called distributed traces. Distributed tracing and correlation of activities is a powerful tool for determining causality within a complex system.Each
trace and span can be uniquely identified, and each span contains a context consisting of Request, Error, and Duration metrics. A trace contains a tree of spans with a single root span.
To serve as an example. I will use a project that I made, which has been heavily inspired (basically trial and error many times to learn) by the demo example in the OpenTelemetry repo.
I will use this project to show usage of OpenTelemetry. There is a client and a server communicating to one endpoint /hello , the client is continuously sending requests with random wait times while the server responds after waiting for a random amount of time. The OpenTelemetry Collector is being run using a docker-compose with Jaeger to visualize the traces and spans and Prometheus to visualize the metrics.
func main() {
 // create a handler wrapped in OpenTelemetry instrumentation
 handler := handleRequestWithRandomSleep()
 wrappedHandler := otelhttp.NewHandler(handler, "/hello")

 // serve up the wrapped handler
 http.Handle("/hello", wrappedHandler)
 http.ListenAndServe(":7080", nil)
}

// handleRequestWithRandomSleep registers a request handler that will record request counts and randomly sleep to induce
// artificial request latency.
func handleRequestWithRandomSleep() http.HandlerFunc {
 var (
  commonLabels = []attribute.KeyValue{
   attribute.String("server-attribute", "foo"),
  }
 )

 return func(w http.ResponseWriter, req *http.Request) {
  //  random sleep to simulate latency
  var sleep int64
  switch modulus := time.Now().Unix() % 5; modulus {
  case 0:
   sleep = rng.Int63n(2000)
  case 1:
   sleep = rng.Int63n(15)
  case 2:
   sleep = rng.Int63n(917)
  case 3:
   sleep = rng.Int63n(87)
  case 4:
   sleep = rng.Int63n(1173)
  }
  time.Sleep(time.Duration(sleep) * time.Millisecond)
  ctx := req.Context()
  span := trace.SpanFromContext(ctx)
  span.SetAttributes(commonLabels...)
  w.Write([]byte("Hello World"))
 }
}
I am recording the latency of the request and response and request count.
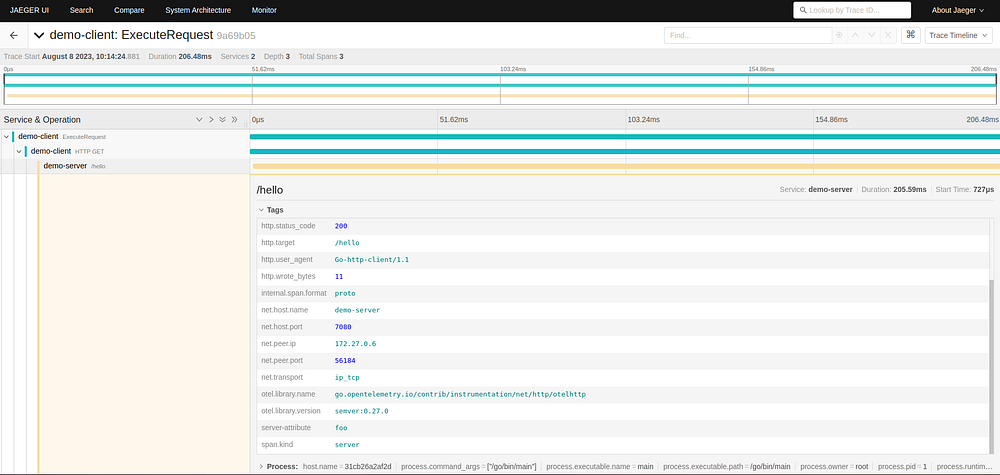
Above is a trace visualized by Jaeger and a span that has been expanded, we can see every information that has been tagged by our server. Any logs associated with this trace would also be shown here.
Metrics
In the context of OpenTelemetry, a metric is like a specific measurement or number that helps you understand how well a certain part of a process is performing. It’s like having a way to quantify how things are going. Just like how you might use the time it takes for your pizza to be delivered as a measurement of the delivery process.
Now, let’s apply this concept to the pizza-ordering process:
Imagine you’re curious about how fast the pizza delivery is, and you want to measure it using a metric. The metric can help you gain insights into how the whole process is working out, the time taken to deliver the pizza, fuel consumption, etc. Aggregated metrics over time can help you gain insights into peak delivery times, delivery boys who are loitering and locations where your pizza is especially popular.
In terms of OpenTelemetry, Metrics are measurements at a given moment of a particular aspect of an application during runtime. An individual capture is called a metric event and consists of a timestamp, a measurement, and associated metadata. The OpenTelemetry API does not allow for custom aggregations but does provide some common aggregations, such as sum, count, last value, and histograms, which are supported by backend visualization and analysis software such as Prometheus.
To give a better idea of when metrics are useful, here are some example scenarios:
- Providing the aggregate total number of bits read or written in a process
- Providing CPU or memory utilization
- Providing the number of requests over a period of time
- Providing the number of errors over a period of time
- Providing the duration of requests to form a statistical distribution of the request processing time
OpenTelemetry offers three types of metrics:
- counter: To count a value over time, such as the number of requests
- measure: To sum or otherwise aggregate a value over a period of time, such as how many bytes are read per minute
- observer: To periodically capture a value, such as memory utilization every minute
We will alter the two functions mentioned above in the code block, adding metric recording functions into the handler:
func handleRequestWithRandomSleep() http.HandlerFunc {
 var (
  meter        = global.Meter("demo-server-meter")
  instruments  = NewServerInstruments(meter)
  commonLabels = []attribute.KeyValue{
   attribute.String("server-attribute", "foo"),
  }
 )

 return func(w http.ResponseWriter, req *http.Request) {
  //  random sleep to simulate latency
  var sleep int64
  switch modulus := time.Now().Unix() % 5; modulus {
  case 0:
   sleep = rng.Int63n(2000)
  case 1:
   sleep = rng.Int63n(15)
  case 2:
   sleep = rng.Int63n(917)
  case 3:
   sleep = rng.Int63n(87)
  case 4:
   sleep = rng.Int63n(1173)
  }
  time.Sleep(time.Duration(sleep) * time.Millisecond)
  ctx := req.Context()
// record metrics
  meter.RecordBatch(
   ctx,
   commonLabels,
   instruments.RequestCount.Measurement(1),
  )
  span := trace.SpanFromContext(ctx)
  span.SetAttributes(commonLabels...)
  w.Write([]byte("Hello World"))
 }
}
Adding one request count every time a request is made and adding it to the metric is what we are doing here.
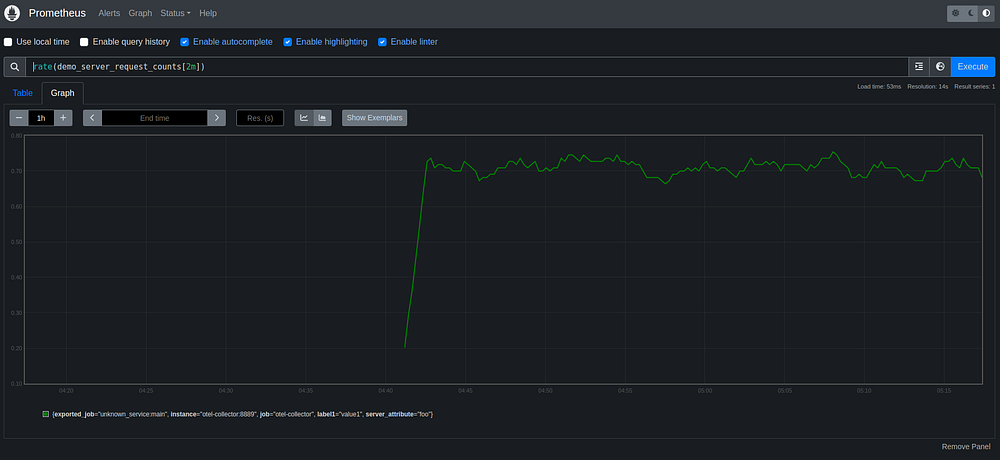
Here is a Prometheus visualization of the metric of request count. We can see the average requests per second for the server application. At the bottom of the screenshot, we will see the common labels and other associated metadata that was added in the server main.go. Prometheus provides a powerful query language to analyze and alert on metrics.
Alerts
One last advantage of OpenTelemetry is the addition of configuring an Alert Manager which can help us pre empt any anomalous event to prevent the dreaded scenario which we thankfully woke up from in the start of this piece. Alertmanager configuration consists mainly of routes and receivers. A route describes where to send an alert based on it either being default or by some criteria. We can send alerts via webhooks to custom endpoints or to 3rd party services like Chatwork or Slack.
We have to define rules to set up alerts. Below, we can see a single group named demo-server specifying a single rule named HighRequestLatency. The rule specifies an expression, which is a Prometheus query. The query triggers when the mean request latency is exceeding 200,000 microseconds, or 0.2 seconds. The alert is triggered with a severity label of page and an annotation summary of high request latency.
groups:
  - name: demo-server
  rules:
    - alert: HighRequestLatency
    expr: | histogram_quantile(0.5, rate(http_server_duration_
    bucket{exported_job="demo-server"}[5m])) > 200000
    labels:
      severity: page
    annotations:
      summary: High request latency
IaaS such as AWS, Azure and GCP all have products which offer the ability to add OpenTelemetry into your multi service stack to ease suffering when debugging within their respective ecosystems.
Amazon Web Services (AWS):
- AWS X-Ray: AWS provides a service called X-Ray, which helps developers analyze and debug distributed applications, including those built on AWS services. X-Ray integrates well with OpenTelemetry, allowing you to send trace data from OpenTelemetry-enabled applications to X-Ray for analysis.
- AWS CloudWatch: AWS CloudWatch offers monitoring and observability services. You can use OpenTelemetry to send trace data to CloudWatch using the CloudWatch Agent or custom instrumentation. This enables you to gain insights into application performance and troubleshoot issues.
Google Cloud Platform (GCP):
- Google Cloud Trace: Google Cloud Trace is GCP’s distributed tracing service that allows you to monitor application performance. It integrates smoothly with OpenTelemetry, enabling you to send trace data to Cloud Trace for analysis.
- Google Cloud Monitoring: GCP provides a monitoring solution called Google Cloud Monitoring (formerly known as Stackdriver). It supports OpenTelemetry-based instrumentation to gather and analyze trace data, helping you gain insights into application behavior.
Microsoft Azure:
- Azure Application Insights: Azure Application Insights is a monitoring and observability service offered by Azure. It supports OpenTelemetry, allowing you to collect and analyze trace data from your applications, providing insights into performance and issues.
- Azure Monitor: Azure Monitor is a comprehensive monitoring solution for Azure services and applications. It supports OpenTelemetry, enabling you to instrument your applications and gather trace data for analysis within Azure Monitor.
In the world of software and technology, complexity often resembles a deliciously topped pizza — layers upon layers of intricacies, processes, and interactions that come together to create a seamless experience. Just as OpenTelemetry serves as the chef’s secret recipe for perfecting the art of pizza-making, it also plays a pivotal role in the digital realm.
As we savor the last bite of our pizza analogy, it’s clear that OpenTelemetry serves as a bridge, connecting the various components of a system into a harmonious symphony. Just as every ingredient in a pizza contributes to its flavor and appeal, each piece of data captured by OpenTelemetry contributes to a holistic understanding of software performance.
So the next time you indulge in your favorite pizza, remember that behind the scenes, OpenTelemetry is also at work — ensuring that your order is seamlessly processed, your pizza is baked to perfection, and your delivery arrives right on time. In this digital age, just as a pizza’s taste is paramount, the smooth operation of software systems is crucial, and OpenTelemetry stands as the conduit through which this excellence is achieved.
As technology continues to evolve and software systems become even more intricate, OpenTelemetry remains a trusted companion, tirelessly gathering data, measuring metrics, and orchestrating the performance of these systems. So, whether you’re enjoying a slice of your favorite pizza or witnessing the prowess of a well-functioning software ecosystem, remember that the secret ingredient to success lies in harmonious orchestration — something both the culinary and digital worlds can wholeheartedly agree upon.
I hope in the preceding few words, I have been able to convince you to start plugging in OpenTelemetry into your multi-service applications. Hopefully, the days of scratching out our hair when errors occur and constantly logging at breakpoints are behind us as we move onto clear vision.
PS: The full code used in this article is present here.
Until next time!